There's one key metric predicting NYC development
We know where new residential development is happening. But it turns out that this, usually, isn't what you want to know. What you really need is to know where new development will happen. Otherwise, you're just chasing the past.
At CityTracker, we've developed a "Dev Score" that tells you how likely development is on a lot. While the full calculation is complex, the results are driven by a simple intuition, closely following how real estate developers operate.
Developers chase what I'll coin addable surplus (see a derivation in the appendix):
Addable Surplus = (Zoning Square Feet Addable)
                x (Sale price per square foot - Cost per square foot)
It's because that's really how a developer makes money: First, you need to make sure you're in a high-demand area, so that you can sell for more than the cost to build. And once that's true, every square foot you can add is profit. To be a profitable development, the addable value needs to cover the purchase cost for whatever is on the lot right now.
Our "Dev Score" is our estimate of the likelihood of development (expressed as a score between 1 and 100).
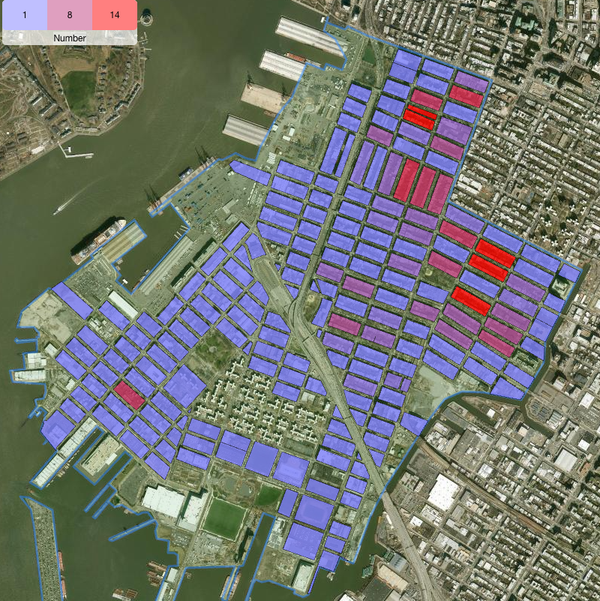
Let's look at some examples. The following is from Rogers and Montgomery St in Brooklyn. There's huge differences in the dev score, even within a block. What's driving this?
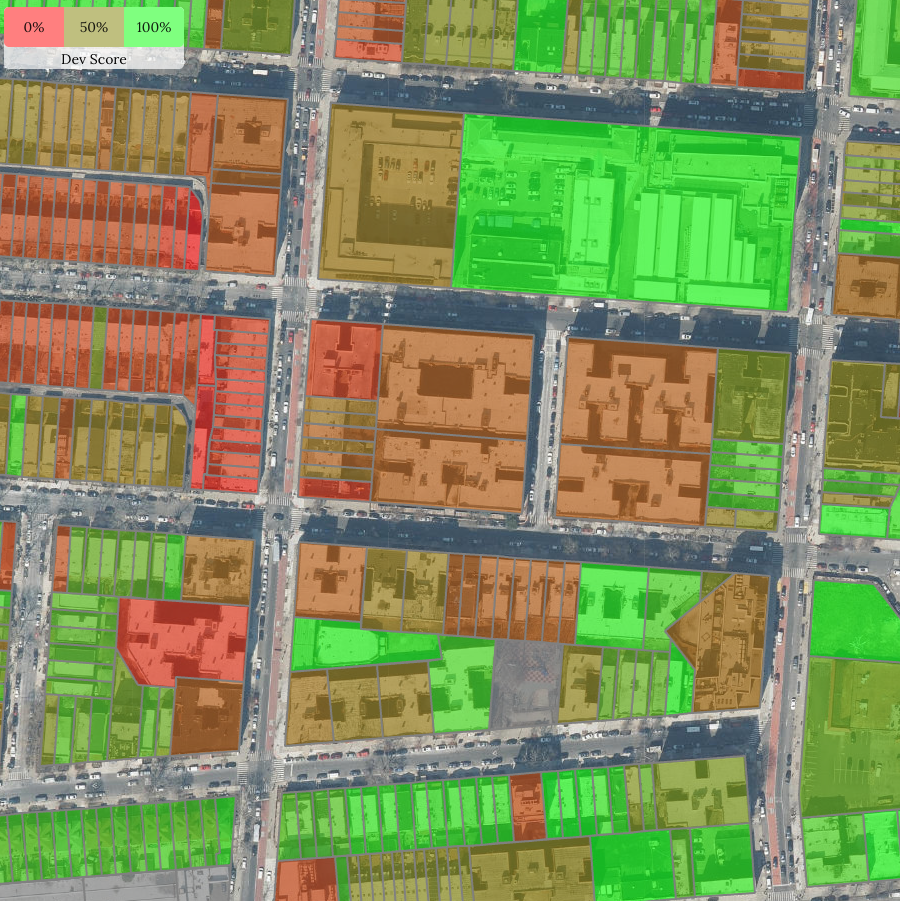
Image 1: Lot-level dev score, near Rogers and Montgomery St in Brooklyn
Note: The dev score and these maps are available, for free, at our companion app, https://zonedinsights.com
A key factor is the Floor-Area-Ratio (FAR) for a lot. In the map, it ranges from 1.0 to 4.0, which we show below. When we display developments since 2010, we find that all of them happened on lots with an FAR of 2.5 or higher.
Why is that? Because FAR is a key input for addable value!
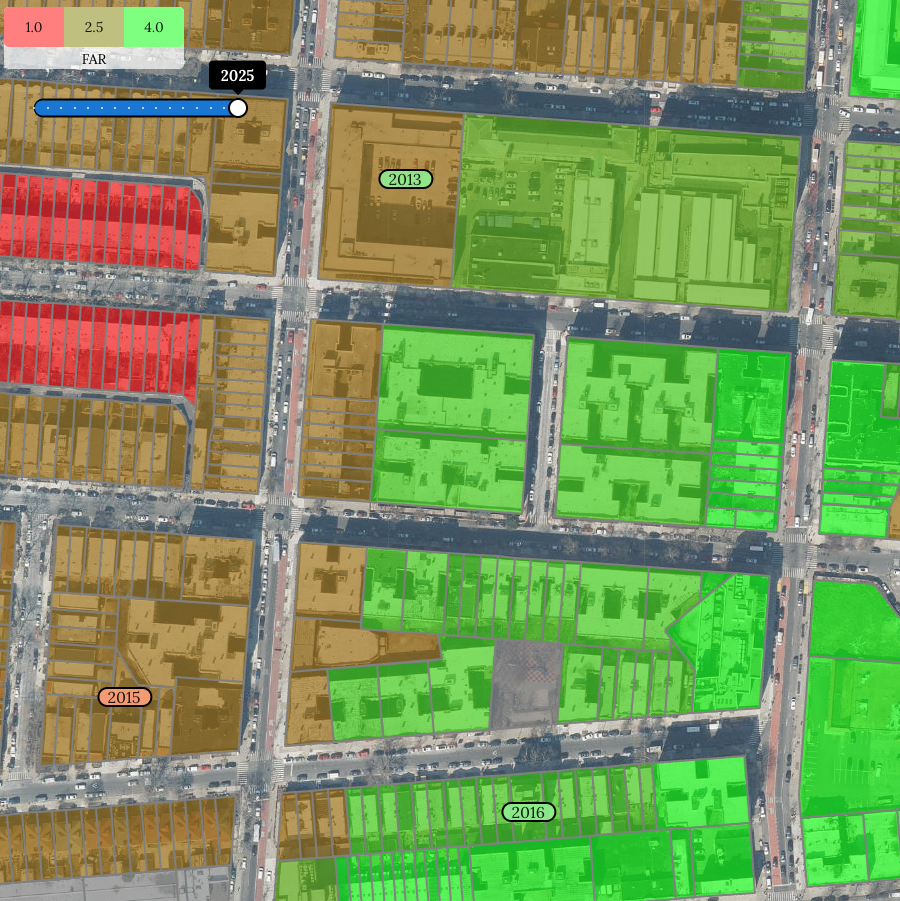
Image 2: Lot-level FAR
If we average the dev score at a block level, we can look at the whole city at once, to get a consistent way of identifying where development will happen.
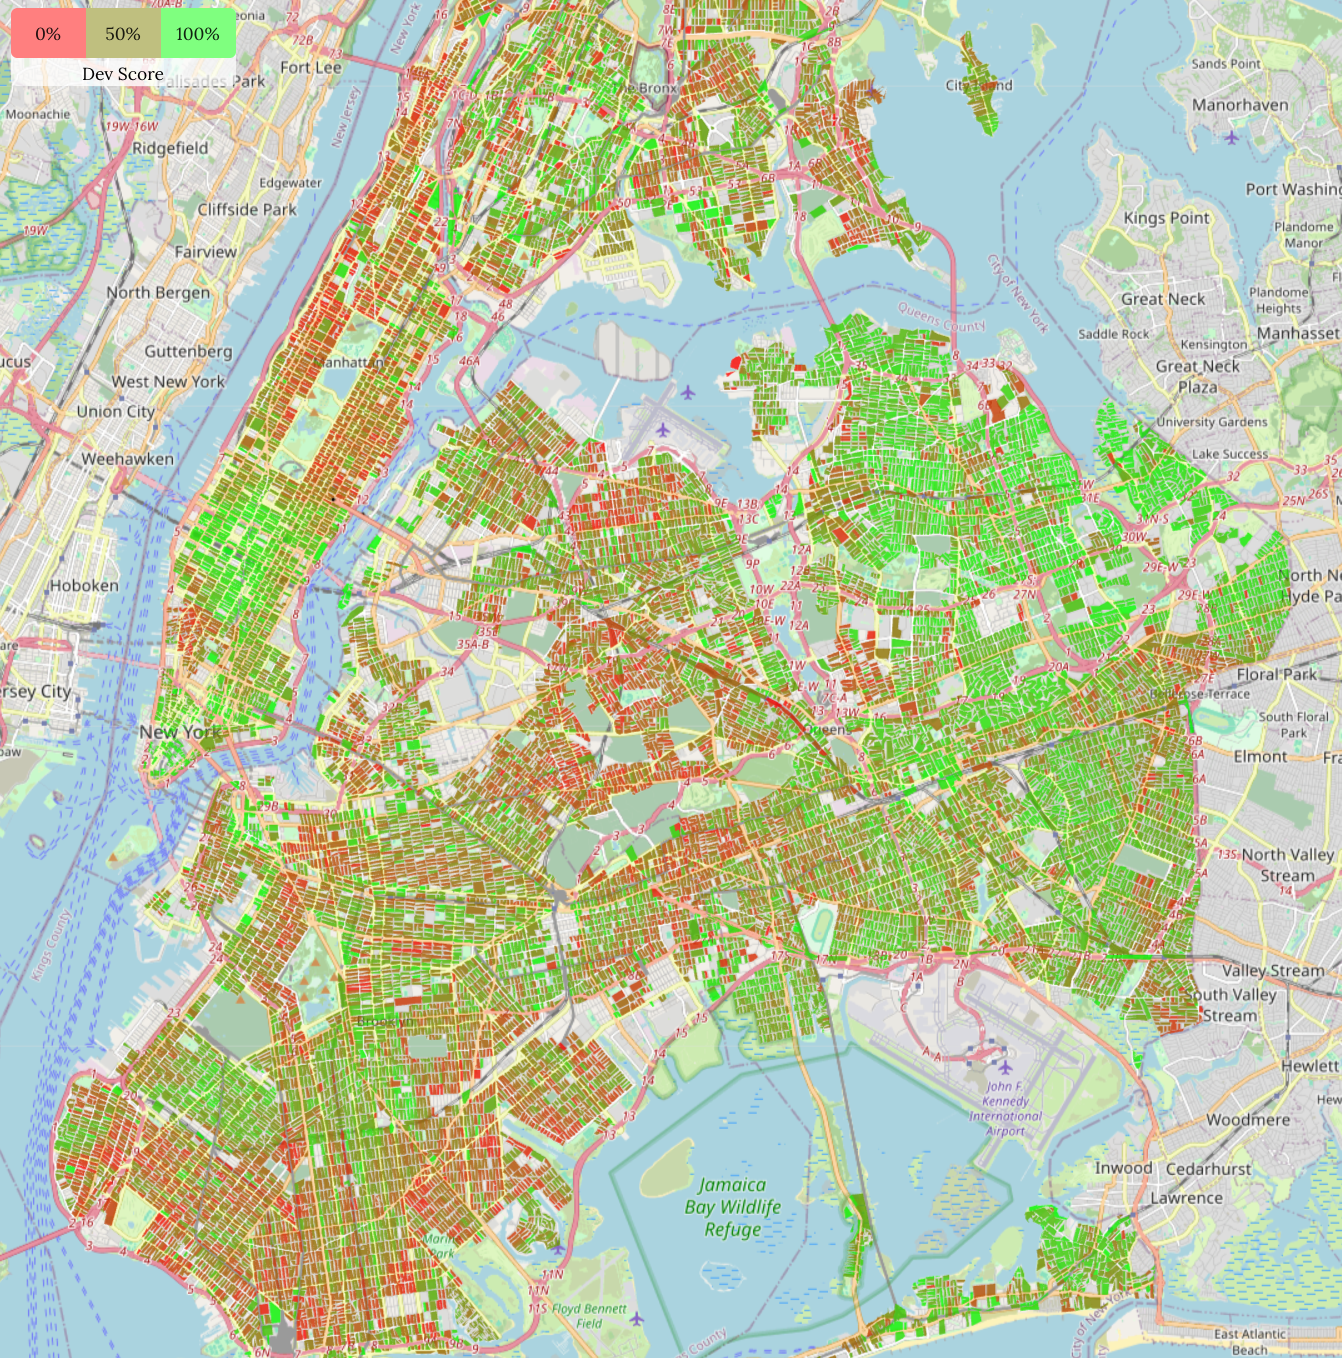
Image 3: Dev score city-wide, showing block-level averages
This is (to our knowledge) the first model to holistically predict development in NYC and give you lot-by-lot resolution.
This score uses a small number of predictors: FAR, lot size, location, zoning district, and these predictors drive the large majority of development decisions. We don't yet account for ULURP actions, air rights, or complex purchases.
So far, we've talked about this score as a way to "predict". But another way to look at it is that it helps you identify lots that will get developed by your competitors, if you don't act first. So really, those are leads. They aren't fully qualified (yet), because you can't know that the owner will sell, but they make great candidates for lots you should be considering.
Appendix
Deriving the "Addable Surplus"
Let's call the p the sales price per square foot and c the cost per square foot. The current building area is a0 and we can build up to a1. How much profit do we make?
Profit = Sale price - Cost - Purchase Price
       = a1 x p - a1 x c - a0 x p
       = (a1-a0) x (p-c) - a0 x c
       = (Addable Surplus) - (Baseline cost)
We're looking for a simple, intuitive metric here. So we're assuming that the developer is choosing between properties with similar current buildout, in which case the baseline cost is constant, and the profit-maximizing choice depends only on the addable surplus.