Understanding our permit prediction
Our goal is to help you find good jobs that are about to come up. Essentially, this is a problem of prediction. And to do that well, we must first understand how the process works, especially for new construction. Here, we provide a non-technical overview of our approach, with technical details in the appendix.
New construction is a great way to build the intuition: Let's look at all the lots were a filing was approved for 2022, and we see that, across the major permit categories, these lots (called "New") have 2x to 8x more permits than an average lot (called "Baseline"). This is part of the data we show on our homepage:
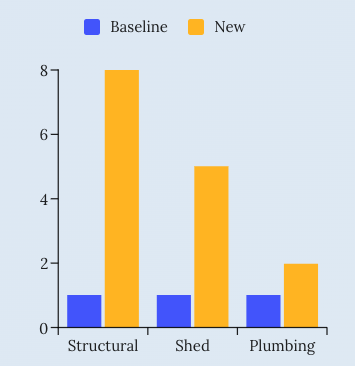
One way to think of this: Defining leads just based on new construction is a good start, but new leads are much more predictive for some work types than others.
We then build on this by using a much wider range of data to predict permits:
- Location
- Filing characteristics (unit size, etc)
- Lot characteristics
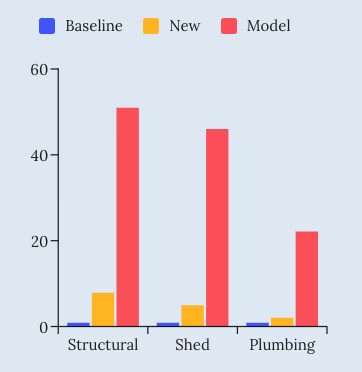
We use a standard predictive model, and then validate the results with data from the following year. To fairly compare results, we say: "Create just as many leads as using the "new construction" methods. And it turns out that those new leads perform much, much better, outperforming the "new" method by a factor of 6x to 10x, and the baseline by 22x to 51x.
Appendix
Dataset
Our master dataset has one row per tax-lot and year (2021-2025), which we call lot-year. For each row, we merge on filing data from the lot-year and permit data from the next year, so that permits in year (n+1) can be predicted from filing data in year (n).
Approximate data size:
- Tax Lots: 850K
- Filings: 381K (DOB + DOB Now)
- Permits: 599K (DOB NOW, 2021+)
We then run a LightGBM model in Python, with parameters below.
params = {
    'objective': 'regression',
    'metric': 'rmse',
    'boosting_type': 'gbdt',
    'num_leaves': 31,
    'learning_rate': 0.05,
    'feature_fraction': 0.9
}
We fully separate training and test data. To evaluate a model trained with data from year n, we apply this prediction to a dataset from year n+1.
Our key performance metric is the average number of permits among leads, in the test sample.
We're comparing performance from three methods, all using the test data:
- Baseline: The average number of permits (AP) in the sample
- New: AP among the tax-lots with an approved filing in that year. We call the number of such lots N
- Model: AP among the N tax-lots with the highest predicted model score.
We are fixing the number of leads between the methods (2) and (3) to run a fair comparison, to ensure AP is not driven by the number of leads, but only their quality.